> ## Documentation Index
> Fetch the complete documentation index at: https://docs.cloudidr.com/llms.txt
> Use this file to discover all available pages before exploring further.
# Agent Traces
Cloudidr **Agent Traces** gives you cost visibility inside a single agent run — not just across all requests in aggregate, but step by step, in the exact sequence they executed.
When a user sends one question to your AI agent, the agent typically fires multiple LLM calls in sequence: a planner, a retriever, a summarizer, a formatter. Today those appear as four separate rows in the Activity log with no indication they belong together. Agent Traces groups them automatically and shows you which step cost the most, which one Cloudidr routed to a cheaper model, and where the time went.
> **Availability:** Agent Traces is available on **Growth, Scale, and Enterprise** plans. Not available on Starter.
> **This is not a debugging tool.** Cloudidr does not store prompts or completions. Traces answer one question: *"Which step in my agent costs the most and what did Cloudidr do about it?"* For prompt debugging and chain internals, use LangSmith or Braintrust alongside Cloudidr.
***
## How to instrument
No SDK install required. Add two HTTP headers to every LLM call in your agent run.
### Headers
| Header | Purpose | Example |
| ------------- | ------------------------------------------------------------------------------------ | --------------------------------- |
| `X-Trace-Id` | A unique ID for the entire agent run — all calls sharing this ID appear as one trace | `"conv_abc123"` or a UUID |
| `X-Span-Name` | A label for this individual step within the run | `"query_planner"`, `"summarizer"` |
Both headers are **optional**. Requests without them continue to be logged in the Activity tab as before. They have no effect on routing or billing.
### Python (OpenAI SDK)
```python theme={null}
import uuid
trace_id = str(uuid.uuid4()) # generate once per agent run
# Step 1
response = openai.chat.completions.create(
model="gpt-4o",
messages=[...],
extra_headers={
"X-Cloudidr-Key": "trk_xxx",
"X-Trace-Id": trace_id,
"X-Span-Name": "query_planner"
}
)
# Step 2 — same trace_id, different span name
response = openai.chat.completions.create(
model="gpt-4o",
messages=[...],
extra_headers={
"X-Cloudidr-Key": "trk_xxx",
"X-Trace-Id": trace_id,
"X-Span-Name": "summarizer"
}
)
```
### Python (Anthropic SDK)
```python theme={null}
import uuid
trace_id = str(uuid.uuid4())
client = anthropic.Anthropic()
response = client.messages.create(
model="claude-sonnet-4-6",
max_tokens=1024,
messages=[...],
extra_headers={
"X-Cloudidr-Key": "trk_xxx",
"X-Trace-Id": trace_id,
"X-Span-Name": "intent_classifier"
}
)
```
### Using an existing session or conversation ID
You do not need to generate a new UUID. If your application already tracks a `session_id`, `conversation_id`, or `request_id`, pass it directly as `X-Trace-Id`. Any string works — Cloudidr groups all calls sharing the same value under one trace.
```python theme={null}
trace_id = session.id # your existing session identifier
```
***
## Traces list page
Navigate to **Sidebar → Traces** (under Analytics).
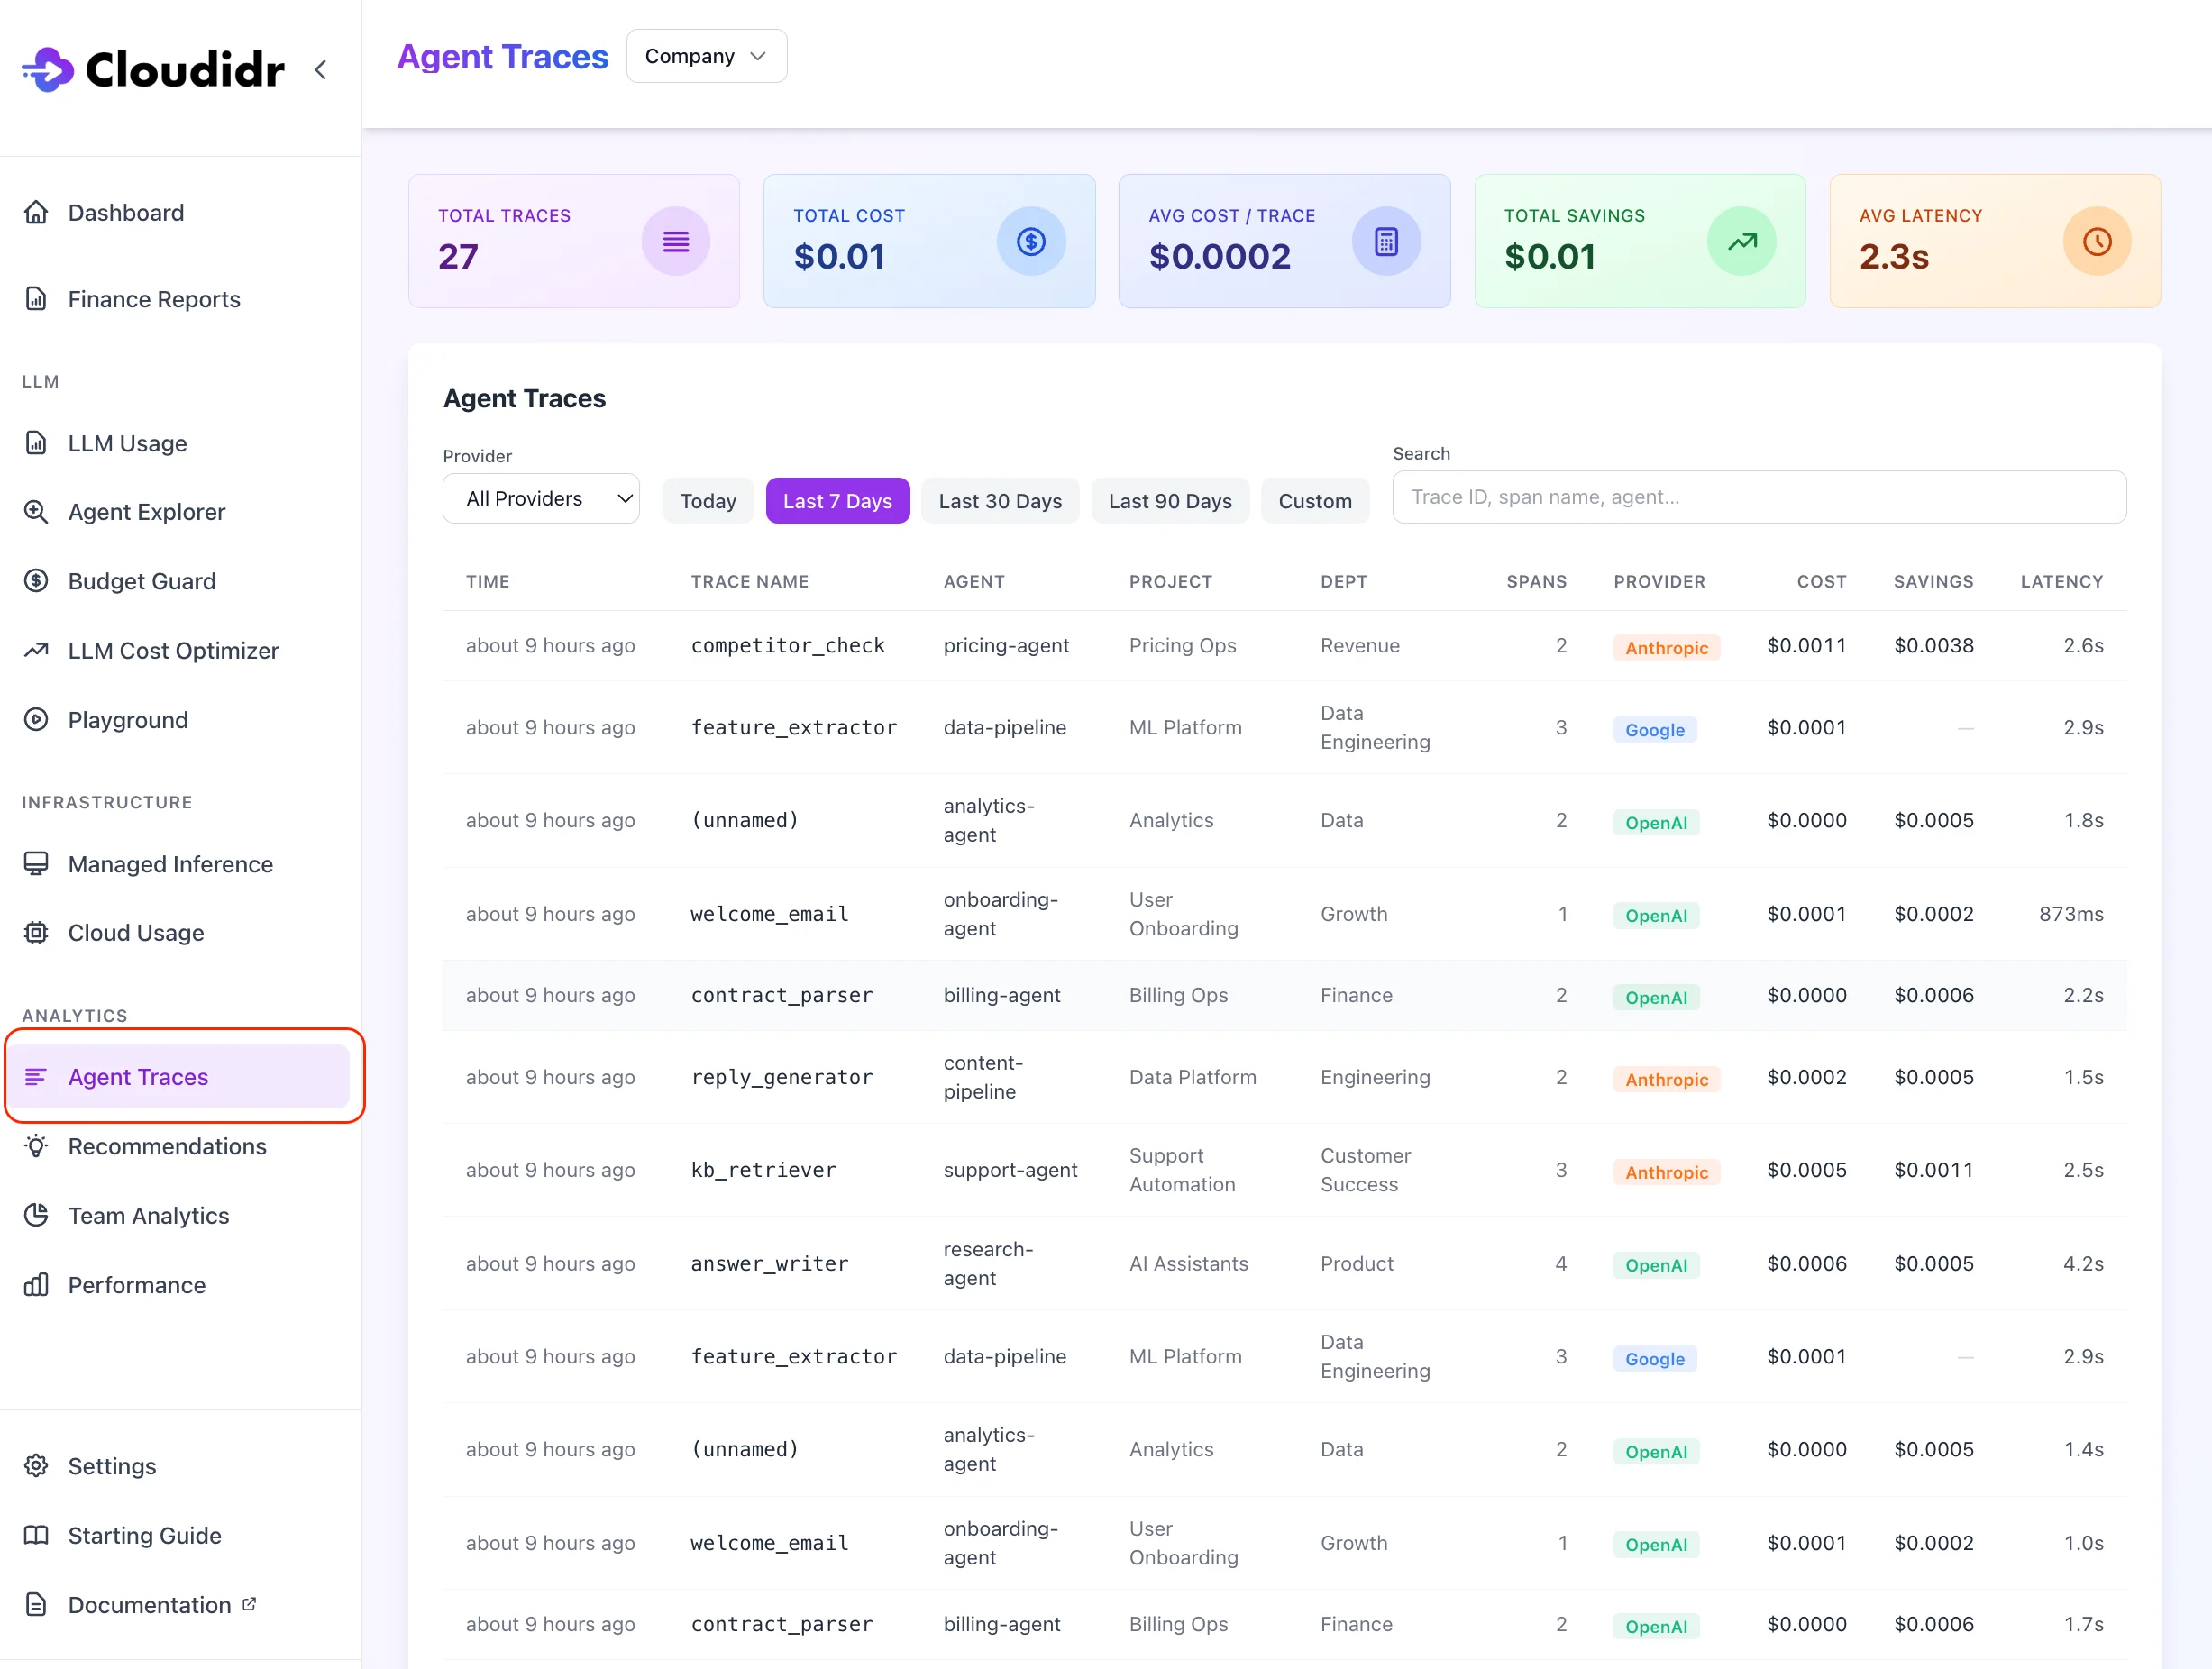 ### Summary cards
Four cards at the top respond to your active filters:
| Card | Value |
| -------------------- | ---------------------------------------------------- |
| **Total Traces** | Count of distinct agent runs in the selected period |
| **Total Cost** | Combined LLM cost across all traces |
| **Avg Cost / Trace** | Mean cost per agent run |
| **Total Savings** | Routing savings Cloudidr generated across all traces |
### Filters
| Filter | Options |
| -------------- | ---------------------------------------------------------------------- |
| **Date range** | Today / Last 7 Days / Last 30 Days / Last 90 Days / 1 Year / Custom |
| **Provider** | All Providers / OpenAI / Anthropic / Google |
| **Search** | Free-text search on Trace ID, Span Name, Agent, Project, or Department |
### Trace list table
Each row represents one agent run (one unique `X-Trace-Id`):
| Column | Description |
| -------------- | ----------------------------------------------------------------------------------------------------------------------------------------------------------------------------------------------------------------- |
| **Time** | When the first span in this trace arrived |
| **Trace Name** | The first `X-Span-Name` value seen for this trace, or the Trace ID if no span name was set |
| **Agent** | The `X-Agent` tag on the requests |
| **Project** | The `X-Project` tag |
| **Dept** | The `X-Department` tag |
| **Spans** | Total number of LLM calls in this trace |
| **Provider** | Provider(s) used (shown as the dominant provider) |
| **Cost** | Total LLM cost for this trace |
| **Savings** | Total routing savings Cloudidr generated across all spans in this trace |
| **Latency** | Wall-clock time from when the proxy received the first span to when it received the complete response for the last span — this is proxy-measured time and excludes the final network hop back to your application |
Click any row to open the Trace Detail view.
**Load more** — the list loads 20 traces at a time. Click **Load more** at the bottom to page through additional results.
***
## Trace detail — waterfall view
Clicking a row opens the trace detail view, showing a waterfall chart of all spans in the order they were received by the proxy.
### Waterfall columns
| Column | Description |
| ------------ | --------------------------------------------------------------------------------------------------------------------------------------- |
| **Step** | The `X-Span-Name` for this span; most-expensive step is marked with ⚡ |
| **Timeline** | Horizontal bar proportional to this span's latency relative to the total trace duration |
| **Latency** | Time from when the proxy received this request to when it received the complete provider response |
| **Model** | The model requested and, if Cloudidr routed to a different model, the routed model shown with a `→` arrow (e.g. `gpt-4o → gpt-4o-mini`) |
| **Cost** | Actual cost for this span at the routed model's price |
| **Savings** | Cost saved vs. the originally requested model's price (shown when Cloudidr routed) |
### Tool call rows
When an LLM call invokes a tool (web search, database lookup, function call), Cloudidr detects the tool invocation from the provider response and inserts a greyed-out row for each tool called, placed immediately after the LLM span that triggered it.
### Summary cards
Four cards at the top respond to your active filters:
| Card | Value |
| -------------------- | ---------------------------------------------------- |
| **Total Traces** | Count of distinct agent runs in the selected period |
| **Total Cost** | Combined LLM cost across all traces |
| **Avg Cost / Trace** | Mean cost per agent run |
| **Total Savings** | Routing savings Cloudidr generated across all traces |
### Filters
| Filter | Options |
| -------------- | ---------------------------------------------------------------------- |
| **Date range** | Today / Last 7 Days / Last 30 Days / Last 90 Days / 1 Year / Custom |
| **Provider** | All Providers / OpenAI / Anthropic / Google |
| **Search** | Free-text search on Trace ID, Span Name, Agent, Project, or Department |
### Trace list table
Each row represents one agent run (one unique `X-Trace-Id`):
| Column | Description |
| -------------- | ----------------------------------------------------------------------------------------------------------------------------------------------------------------------------------------------------------------- |
| **Time** | When the first span in this trace arrived |
| **Trace Name** | The first `X-Span-Name` value seen for this trace, or the Trace ID if no span name was set |
| **Agent** | The `X-Agent` tag on the requests |
| **Project** | The `X-Project` tag |
| **Dept** | The `X-Department` tag |
| **Spans** | Total number of LLM calls in this trace |
| **Provider** | Provider(s) used (shown as the dominant provider) |
| **Cost** | Total LLM cost for this trace |
| **Savings** | Total routing savings Cloudidr generated across all spans in this trace |
| **Latency** | Wall-clock time from when the proxy received the first span to when it received the complete response for the last span — this is proxy-measured time and excludes the final network hop back to your application |
Click any row to open the Trace Detail view.
**Load more** — the list loads 20 traces at a time. Click **Load more** at the bottom to page through additional results.
***
## Trace detail — waterfall view
Clicking a row opens the trace detail view, showing a waterfall chart of all spans in the order they were received by the proxy.
### Waterfall columns
| Column | Description |
| ------------ | --------------------------------------------------------------------------------------------------------------------------------------- |
| **Step** | The `X-Span-Name` for this span; most-expensive step is marked with ⚡ |
| **Timeline** | Horizontal bar proportional to this span's latency relative to the total trace duration |
| **Latency** | Time from when the proxy received this request to when it received the complete provider response |
| **Model** | The model requested and, if Cloudidr routed to a different model, the routed model shown with a `→` arrow (e.g. `gpt-4o → gpt-4o-mini`) |
| **Cost** | Actual cost for this span at the routed model's price |
| **Savings** | Cost saved vs. the originally requested model's price (shown when Cloudidr routed) |
### Tool call rows
When an LLM call invokes a tool (web search, database lookup, function call), Cloudidr detects the tool invocation from the provider response and inserts a greyed-out row for each tool called, placed immediately after the LLM span that triggered it.
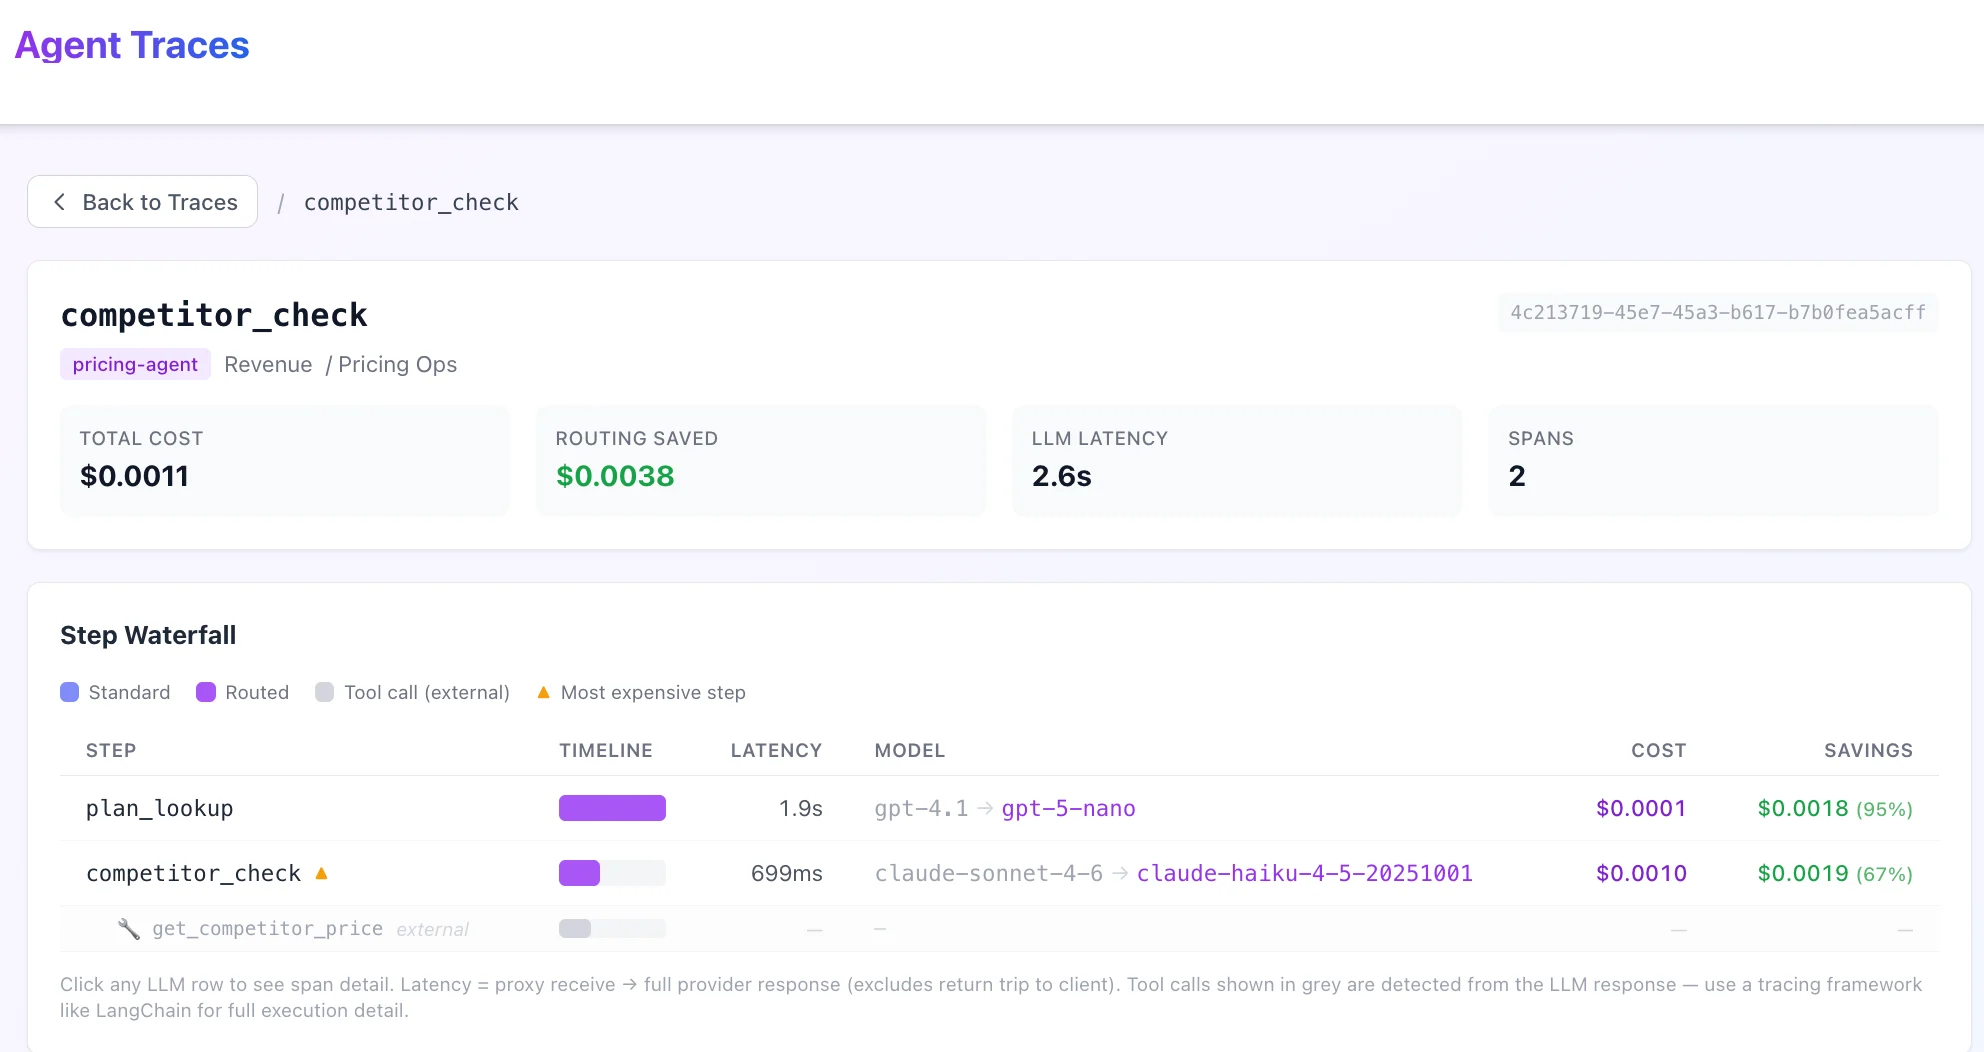 Tool call rows show:
* The tool name (e.g. `web_search`, `get_weather`, `query_database`)
* A wrench icon to distinguish them from LLM spans
* Dashes for Cost and Latency — tool calls are detected from the provider response metadata; Cloudidr does not intercept the tool execution itself
> **Note:** Tool call rows are proxy-detected from the LLM response. They show which tools the model invoked, not how long the tool took to execute. For full tool execution timing and input/output, use a dedicated tracing tool like LangSmith or Arize Phoenix alongside Cloudidr.
***
## Span detail panel
Click any span row in the waterfall to open the span detail panel on the right side.
Tool call rows show:
* The tool name (e.g. `web_search`, `get_weather`, `query_database`)
* A wrench icon to distinguish them from LLM spans
* Dashes for Cost and Latency — tool calls are detected from the provider response metadata; Cloudidr does not intercept the tool execution itself
> **Note:** Tool call rows are proxy-detected from the LLM response. They show which tools the model invoked, not how long the tool took to execute. For full tool execution timing and input/output, use a dedicated tracing tool like LangSmith or Arize Phoenix alongside Cloudidr.
***
## Span detail panel
Click any span row in the waterfall to open the span detail panel on the right side.
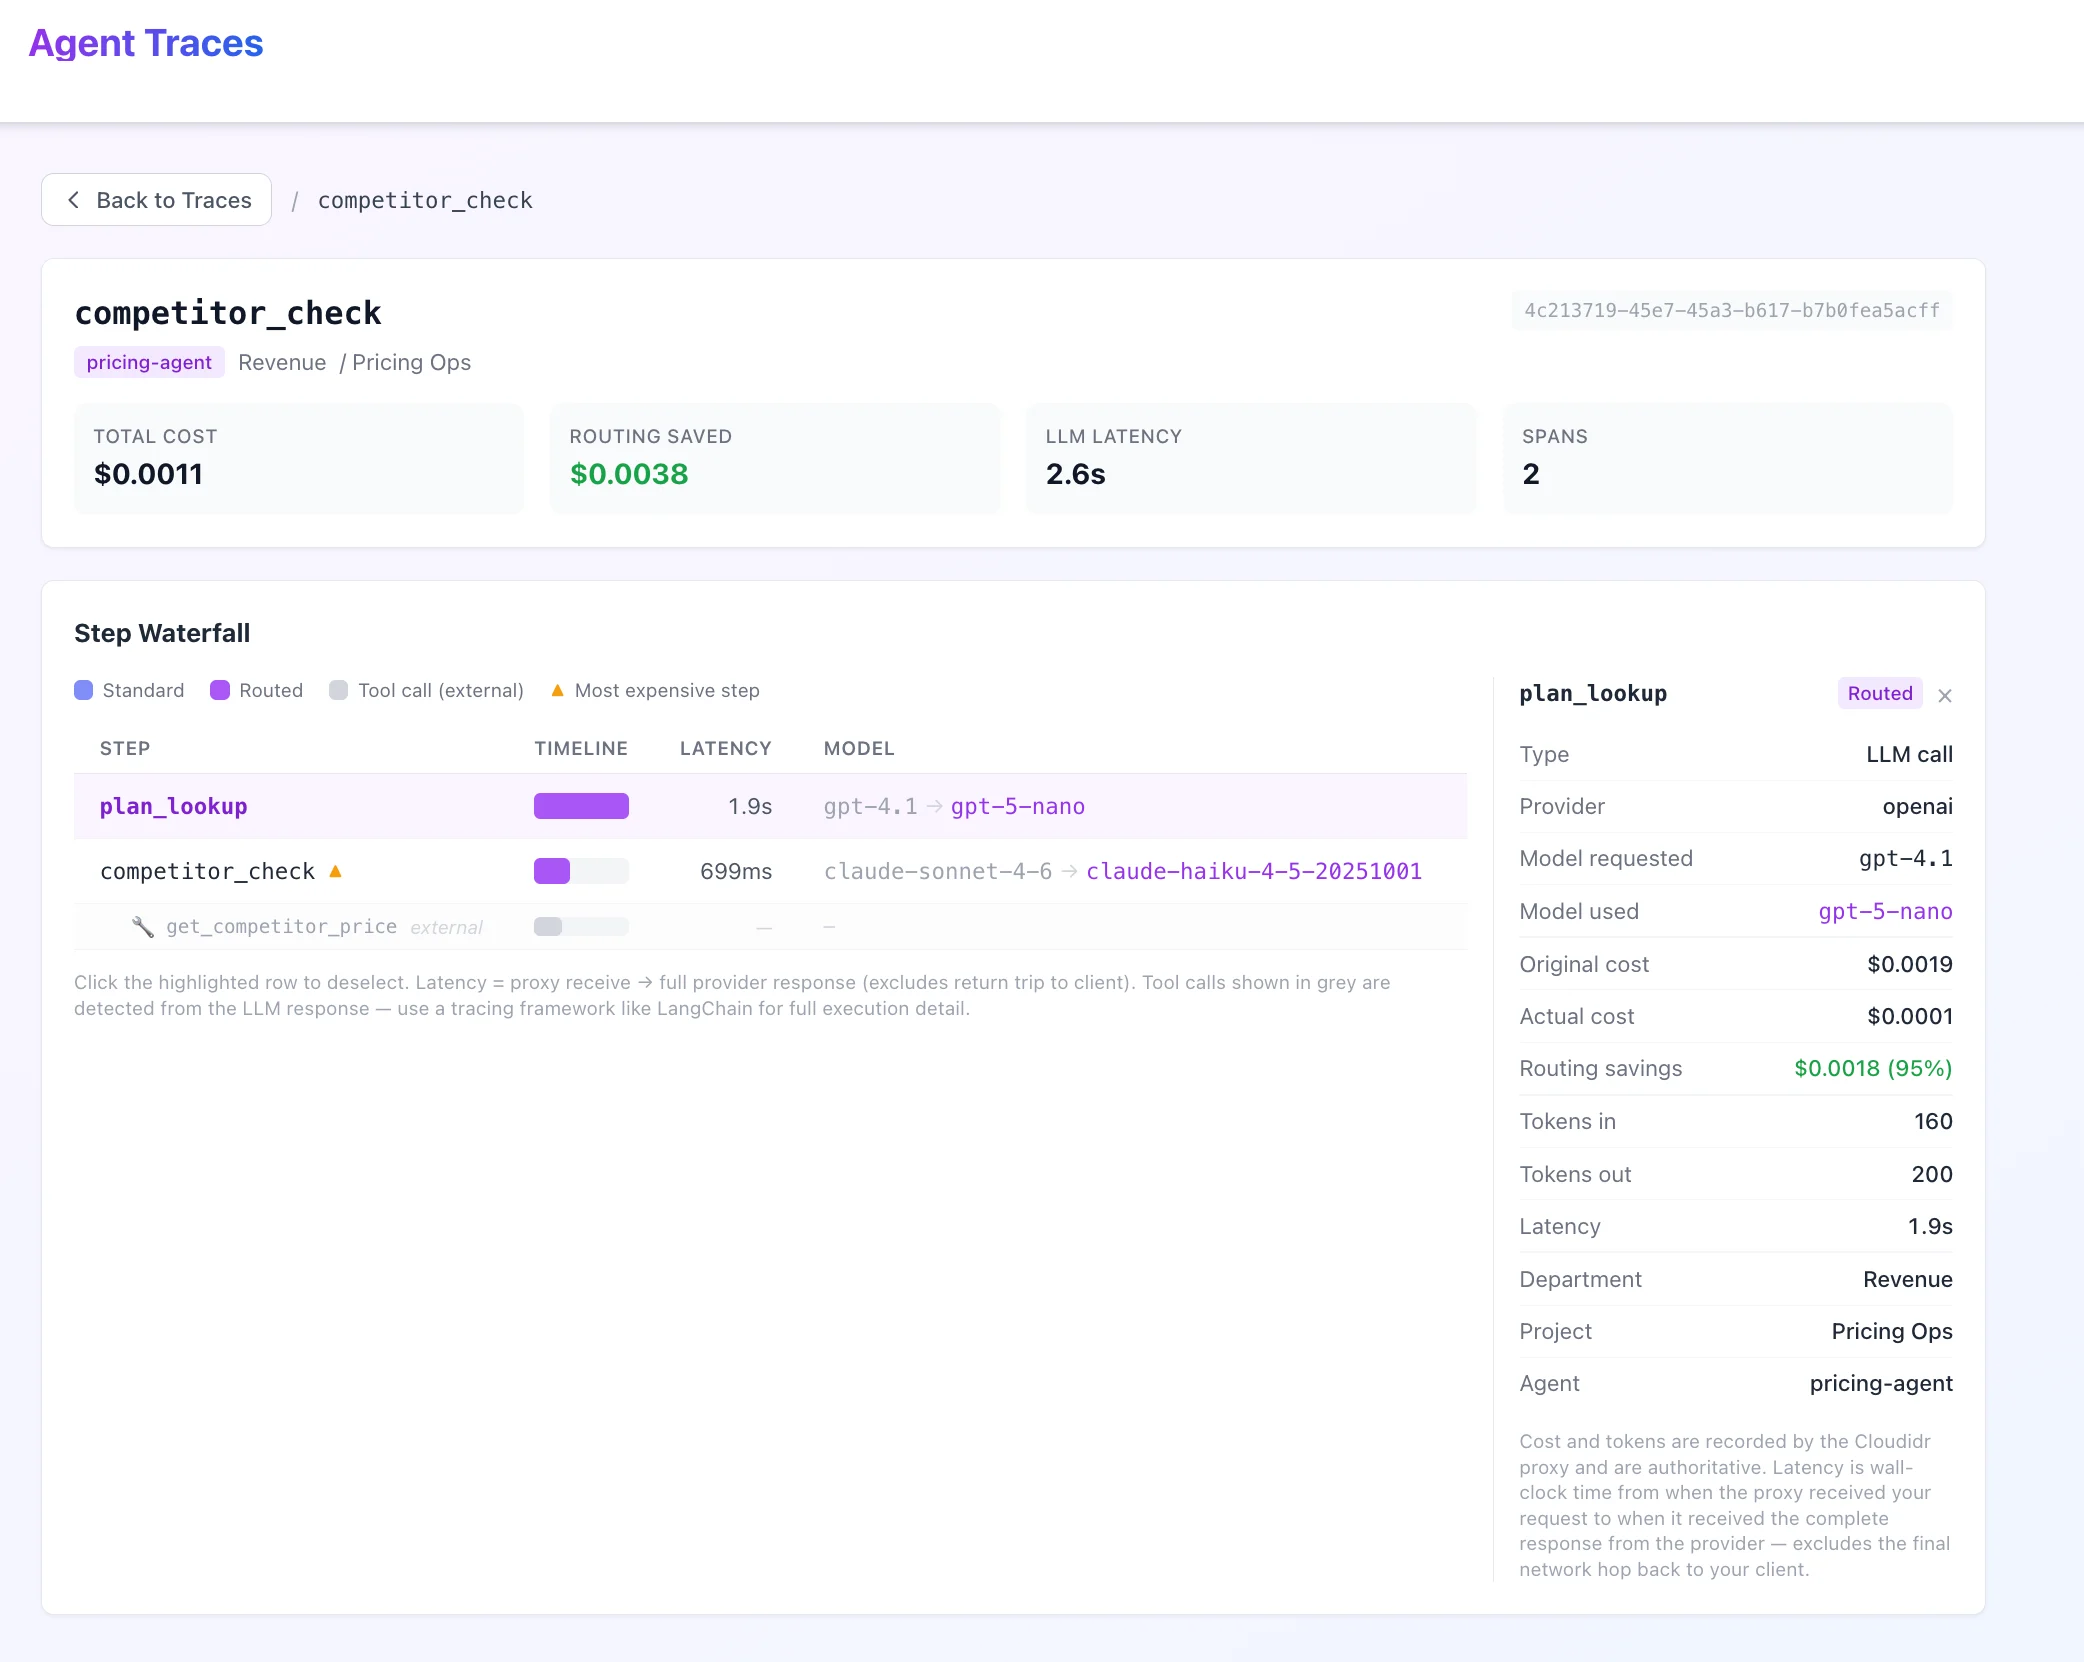 ### Panel contents
**For LLM spans:**
| Field | Description |
| -------------------------------- | ----------------------------------------------------------------- |
| **Span name** | The `X-Span-Name` value |
| **Provider** | LLM provider (OpenAI, Anthropic, Google) |
| **Model requested** | The model your application asked for |
| **Model used** | The model Cloudidr actually routed to (if different) |
| **Input tokens** | Token count sent to the model |
| **Output tokens** | Token count returned by the model |
| **Cost** | Actual cost at the routed model's price |
| **Savings** | Difference between requested model price and routed model price |
| **Latency** | Proxy-measured response time for this span |
| **Timestamp** | When this span was received |
| **Department / Project / Agent** | Org tags from the request headers |
| **Tools called** | If this span invoked tools, a list of tool names appears as pills |
**For tool call rows:**
Tool rows show the tool name and its parent span name only. Cost, tokens, and latency are not available for tool calls (tool execution happens outside the proxy).
***
## Access control
| Role | What they see |
| ----------------- | -------------------------------------------------------------------- |
| **Owner / Admin** | All traces from all users in the organisation |
| **Member** | Only traces from their own requests (filtered by their user account) |
***
## Latency definition
All latency values in Agent Traces are **proxy-measured**: the wall-clock time from when Cloudidr's proxy received your request to when it received the complete response from the LLM provider. This excludes:
* Time your application spent preparing the request before it reached the proxy
* The final network hop from the proxy back to your application
For most agents this difference is negligible. If your agents involve long pre-processing steps or large response streaming, the actual end-to-end latency your users experience will be slightly higher than what Traces reports.
***
## Common patterns
### Identify which step costs the most
The most expensive span in each trace is marked with ⚡ in the Step column. Sort the trace list by **Cost** descending to find your most expensive agent runs, then click in to see which step is responsible.
### See where Cloudidr saved money
The **Savings** column in both the trace list and waterfall shows routing savings per run and per step. A non-zero savings value means Cloudidr detected that the original model was more expensive than needed for that prompt's complexity and routed it to a cheaper equivalent.
### Track a specific agent workflow
Use the **Search** filter to enter a span name (e.g. `summarizer`) or agent name to narrow the list to a specific workflow. Use the **Date range** filter alongside it to scope to a specific deployment window.
### Use your existing session ID as trace ID
If your application already generates a session, conversation, or request ID, pass it as `X-Trace-Id`. You get traces with zero additional ID management — just reuse what you already have.C
### Panel contents
**For LLM spans:**
| Field | Description |
| -------------------------------- | ----------------------------------------------------------------- |
| **Span name** | The `X-Span-Name` value |
| **Provider** | LLM provider (OpenAI, Anthropic, Google) |
| **Model requested** | The model your application asked for |
| **Model used** | The model Cloudidr actually routed to (if different) |
| **Input tokens** | Token count sent to the model |
| **Output tokens** | Token count returned by the model |
| **Cost** | Actual cost at the routed model's price |
| **Savings** | Difference between requested model price and routed model price |
| **Latency** | Proxy-measured response time for this span |
| **Timestamp** | When this span was received |
| **Department / Project / Agent** | Org tags from the request headers |
| **Tools called** | If this span invoked tools, a list of tool names appears as pills |
**For tool call rows:**
Tool rows show the tool name and its parent span name only. Cost, tokens, and latency are not available for tool calls (tool execution happens outside the proxy).
***
## Access control
| Role | What they see |
| ----------------- | -------------------------------------------------------------------- |
| **Owner / Admin** | All traces from all users in the organisation |
| **Member** | Only traces from their own requests (filtered by their user account) |
***
## Latency definition
All latency values in Agent Traces are **proxy-measured**: the wall-clock time from when Cloudidr's proxy received your request to when it received the complete response from the LLM provider. This excludes:
* Time your application spent preparing the request before it reached the proxy
* The final network hop from the proxy back to your application
For most agents this difference is negligible. If your agents involve long pre-processing steps or large response streaming, the actual end-to-end latency your users experience will be slightly higher than what Traces reports.
***
## Common patterns
### Identify which step costs the most
The most expensive span in each trace is marked with ⚡ in the Step column. Sort the trace list by **Cost** descending to find your most expensive agent runs, then click in to see which step is responsible.
### See where Cloudidr saved money
The **Savings** column in both the trace list and waterfall shows routing savings per run and per step. A non-zero savings value means Cloudidr detected that the original model was more expensive than needed for that prompt's complexity and routed it to a cheaper equivalent.
### Track a specific agent workflow
Use the **Search** filter to enter a span name (e.g. `summarizer`) or agent name to narrow the list to a specific workflow. Use the **Date range** filter alongside it to scope to a specific deployment window.
### Use your existing session ID as trace ID
If your application already generates a session, conversation, or request ID, pass it as `X-Trace-Id`. You get traces with zero additional ID management — just reuse what you already have.C