> ## Documentation Index
> Fetch the complete documentation index at: https://docs.cloudidr.com/llms.txt
> Use this file to discover all available pages before exploring further.
# Finance Reports
Cloudidr's **Finance Reports** feature gives owners and CFOs a dedicated view of LLM spend, usage, and budget health — and delivers a curated summary to executives every Monday morning via email.
> **Access:** Finance Reports and Reporting Settings are available to **account owners** only. Team members with other roles do not see the Finance Reports link in the sidebar or the "View Finance Reports" button on the main dashboard.
***
Navigate to **Sidebar → Finance Reports** or click **View Finance Reports** from the main dashboard.
### Spend Summary
Four KPI cards that show spend against your configured budget thresholds:
| Card | Period | Comparison |
| -------------------- | ---------------------------- | ---------------------------------------------------------- |
| **Year to Date** | Jan 1 → today | Traffic light vs yearly budget |
| **Month to Date** | 1st of month → today | % vs same day last month + traffic light vs monthly budget |
| **This Week** | Sat 00:00 → now | % vs same point last week + traffic light vs weekly budget |
| **Projected Annual** | Annualised from YTD run-rate | ± vs yearly budget (if set) |
Traffic lights use the budgets you configure in **Settings → Alert Settings**:
* **Green** — below 80 % of budget
* **Yellow** — 80–99 % of budget
* **Red** — at or over budget
> All period boundaries are calculated in your org's reporting timezone. Configure this in **Settings → Profile → Reporting Timezone**.
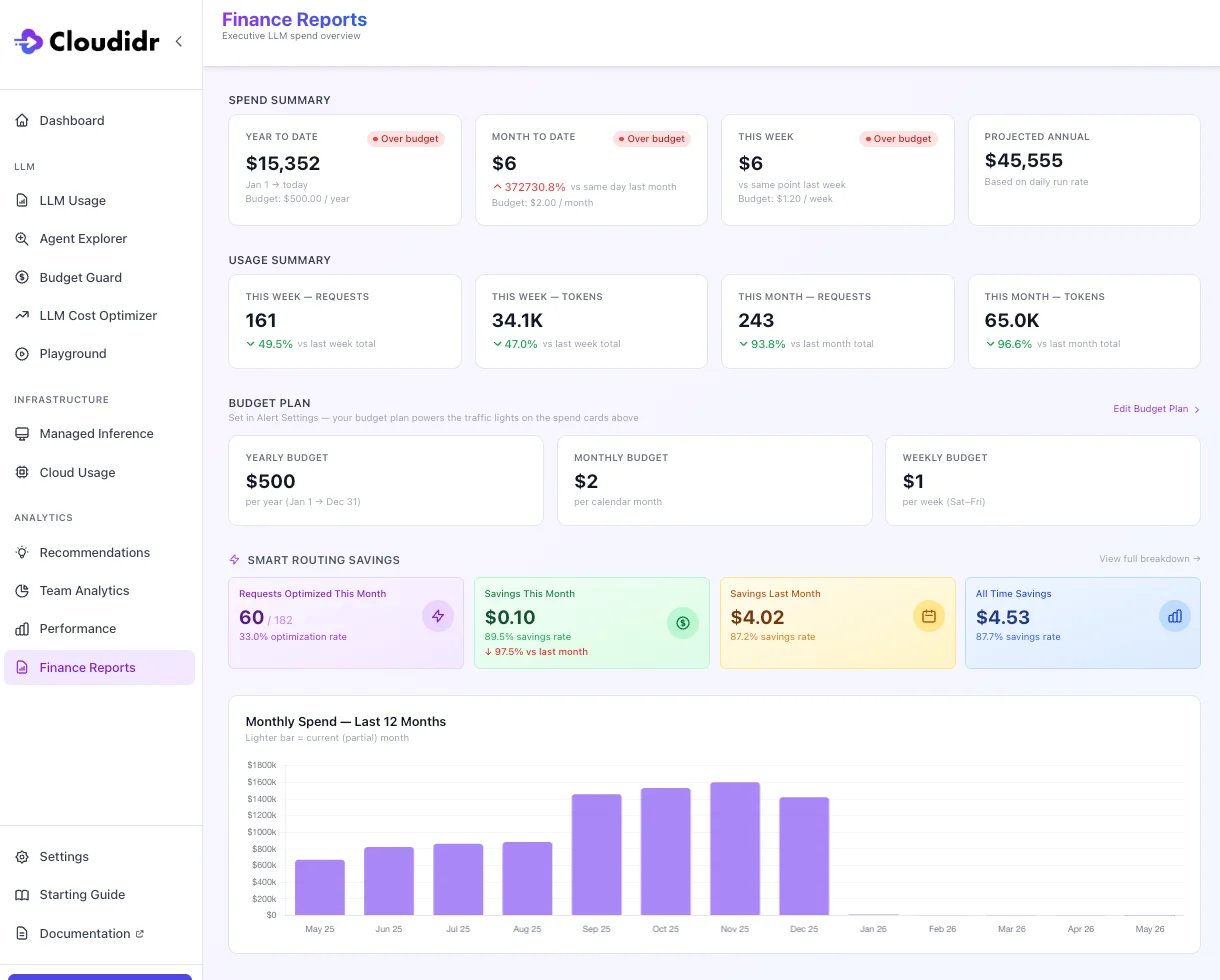 ### Usage Summary
Four KPI cards that show request and token volume alongside spend, so you can distinguish a cost increase driven by *more usage* vs *more expensive requests*:
| Card | Value | Comparison |
| ------------------------- | -------------------------- | ---------------------------- |
| **This Week — Requests** | Requests this week so far | % vs last week's full total |
| **This Week — Tokens** | Tokens this week so far | % vs last week's full total |
| **This Month — Requests** | Requests this month so far | % vs last month's full total |
| **This Month — Tokens** | Tokens this month so far | % vs last month's full total |
Tokens are formatted as `89.2M`, `1.4B` etc. for readability.
### Budget Plan
A read-only view of your budget thresholds (Yearly, Monthly, Weekly) pulled directly from Alert Settings. Click **Edit Budget Plan** to update them in Alert Settings.
> Budget thresholds power the traffic lights on the Spend Summary cards. If no budget is set for a period, the traffic light badge is hidden.
### Smart Routing Savings
Shows the savings generated by Cloudidr's model routing for the current and previous month, plus all-time. See [LLM Cost Optimizer](DOC_llm_cost_optimizer.md) for details.
### 12-Month Spend Chart
A month-by-month bar chart of LLM spend for the past 12 months. The current (partial) month bar is shown in a lighter shade. Toggle between **Spend**, **Requests**, and **Tokens** views using the buttons above the chart.
### Spend Tables
Five ranked tables filtered by the period selector at the top (**Current Week**, **Last Week**, **Current Month**, **Last Month**, **Last 90 Days**, **Year to Date**). Default is **Current Week**.
| Table | Groups by | Rows |
| ---------------------- | -------------------------------------- | ---- |
| **Top 10 Departments** | `department` tag on API requests | 10 |
| **Top 10 Projects** | `team` tag on API requests | 10 |
| **Top 10 Agents** | `agent` tag on API requests | 10 |
| **Top 5 Models** | Model name | 5 |
| **Top 5 Providers** | Provider (Anthropic, OpenAI, Google …) | 5 |
Toggle columns between **Spend**, **Requests**, and **Tokens** using the metric selector above the tables. A date-range sub-label below the period buttons confirms the exact dates being shown.
> **Disclaimer:** Spend figures are estimates based on published list prices. Provider discounts, marketplace credits, and rounding may cause differences from your actual invoice.
***
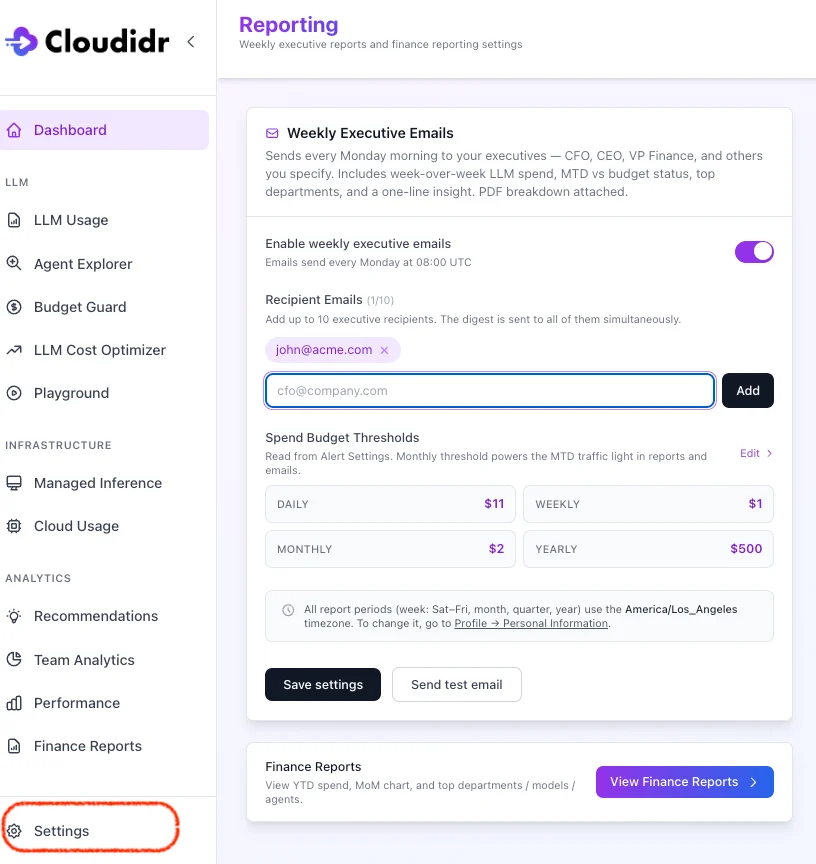
## Email Weekly Finance Summaries
Navigate to **Settings → Reporting** (visible to account owners only).
### Weekly Executive Emails
Enable a weekly HTML email sent every **Monday at 08:00 UTC** to a configurable list of recipients.
**To configure:**
1. Toggle **Enable Weekly Executive Emails** to on.
2. Add recipient email addresses (one per line or comma-separated).
3. Click **Save**.
Use **Send Test Email** to trigger an immediate test send to all configured recipients without waiting for Monday.
### Usage Summary
Four KPI cards that show request and token volume alongside spend, so you can distinguish a cost increase driven by *more usage* vs *more expensive requests*:
| Card | Value | Comparison |
| ------------------------- | -------------------------- | ---------------------------- |
| **This Week — Requests** | Requests this week so far | % vs last week's full total |
| **This Week — Tokens** | Tokens this week so far | % vs last week's full total |
| **This Month — Requests** | Requests this month so far | % vs last month's full total |
| **This Month — Tokens** | Tokens this month so far | % vs last month's full total |
Tokens are formatted as `89.2M`, `1.4B` etc. for readability.
### Budget Plan
A read-only view of your budget thresholds (Yearly, Monthly, Weekly) pulled directly from Alert Settings. Click **Edit Budget Plan** to update them in Alert Settings.
> Budget thresholds power the traffic lights on the Spend Summary cards. If no budget is set for a period, the traffic light badge is hidden.
### Smart Routing Savings
Shows the savings generated by Cloudidr's model routing for the current and previous month, plus all-time. See [LLM Cost Optimizer](DOC_llm_cost_optimizer.md) for details.
### 12-Month Spend Chart
A month-by-month bar chart of LLM spend for the past 12 months. The current (partial) month bar is shown in a lighter shade. Toggle between **Spend**, **Requests**, and **Tokens** views using the buttons above the chart.
### Spend Tables
Five ranked tables filtered by the period selector at the top (**Current Week**, **Last Week**, **Current Month**, **Last Month**, **Last 90 Days**, **Year to Date**). Default is **Current Week**.
| Table | Groups by | Rows |
| ---------------------- | -------------------------------------- | ---- |
| **Top 10 Departments** | `department` tag on API requests | 10 |
| **Top 10 Projects** | `team` tag on API requests | 10 |
| **Top 10 Agents** | `agent` tag on API requests | 10 |
| **Top 5 Models** | Model name | 5 |
| **Top 5 Providers** | Provider (Anthropic, OpenAI, Google …) | 5 |
Toggle columns between **Spend**, **Requests**, and **Tokens** using the metric selector above the tables. A date-range sub-label below the period buttons confirms the exact dates being shown.
> **Disclaimer:** Spend figures are estimates based on published list prices. Provider discounts, marketplace credits, and rounding may cause differences from your actual invoice.
***
## Email Weekly Finance Summaries
Navigate to **Settings → Reporting** (visible to account owners only).
### Weekly Executive Emails
Enable a weekly HTML email sent every **Monday at 08:00 UTC** to a configurable list of recipients.
**To configure:**
1. Toggle **Enable Weekly Executive Emails** to on.
2. Add recipient email addresses (one per line or comma-separated).
3. Click **Save**.
Use **Send Test Email** to trigger an immediate test send to all configured recipients without waiting for Monday.
 ### What the email contains
Each email covers the **previous full week (Saturday 00:00 → Friday 23:59)** in your org's reporting timezone and includes:
| Section | Details |
| --------------------------------- | --------------------------------------------------------------------------------------------------------------------- |
| **This Week Spend** | Total spend with week-over-week % change and request count |
| **Month to Date vs Budget** | MTD spend against your monthly budget with traffic light |
| **Year to Date vs Yearly Budget** | YTD spend against your yearly budget with traffic light |
| **Projected Annual Spend** | Annualised YTD run-rate, shown ± vs yearly budget |
| **Usage Summary** | Requests and tokens for the week with WoW % change vs last week's full total |
| **Week-over-Week Movements** | Bulleted list of departments and projects with ↑/↓ changes ≥ 10% vs the prior week, sorted by largest absolute change |
| **Top 3 Departments** | Highest-spend departments for the week with spend and request count |
| **Top 3 Projects** | Highest-spend projects (team tag) for the week with spend and request count |
The email footer includes a link to the full Finance Reports page and a link to manage recipients in Reporting Settings.
### Budget thresholds in the email
The email pulls budget thresholds from your existing **Alert Settings** — there is no separate budget to configure in Reporting Settings. To change thresholds, go to **Settings → Alert Settings → Overall Budget**.
### Timezone
All period boundaries in both the Finance Reports page and the weekly email respect the org-level **Reporting Timezone** set in **Settings → Profile**. The timezone used is always stated in the email header and footer.
### What the email contains
Each email covers the **previous full week (Saturday 00:00 → Friday 23:59)** in your org's reporting timezone and includes:
| Section | Details |
| --------------------------------- | --------------------------------------------------------------------------------------------------------------------- |
| **This Week Spend** | Total spend with week-over-week % change and request count |
| **Month to Date vs Budget** | MTD spend against your monthly budget with traffic light |
| **Year to Date vs Yearly Budget** | YTD spend against your yearly budget with traffic light |
| **Projected Annual Spend** | Annualised YTD run-rate, shown ± vs yearly budget |
| **Usage Summary** | Requests and tokens for the week with WoW % change vs last week's full total |
| **Week-over-Week Movements** | Bulleted list of departments and projects with ↑/↓ changes ≥ 10% vs the prior week, sorted by largest absolute change |
| **Top 3 Departments** | Highest-spend departments for the week with spend and request count |
| **Top 3 Projects** | Highest-spend projects (team tag) for the week with spend and request count |
The email footer includes a link to the full Finance Reports page and a link to manage recipients in Reporting Settings.
### Budget thresholds in the email
The email pulls budget thresholds from your existing **Alert Settings** — there is no separate budget to configure in Reporting Settings. To change thresholds, go to **Settings → Alert Settings → Overall Budget**.
### Timezone
All period boundaries in both the Finance Reports page and the weekly email respect the org-level **Reporting Timezone** set in **Settings → Profile**. The timezone used is always stated in the email header and footer.