

Access: Finance Reports and Reporting Settings are available to account owners only. Team members with other roles do not see the Finance Reports link in the sidebar or the “View Finance Reports” button on the main dashboard.
Navigate to Sidebar → Finance Reports or click View Finance Reports from the main dashboard.
Spend Summary
Four KPI cards that show spend against your configured budget thresholds:
Traffic lights use the budgets you configure in Settings → Alert Settings:
- Green — below 80 % of budget
- Yellow — 80–99 % of budget
- Red — at or over budget
All period boundaries are calculated in your org’s reporting timezone. Configure this in Settings → Profile → Reporting Timezone.
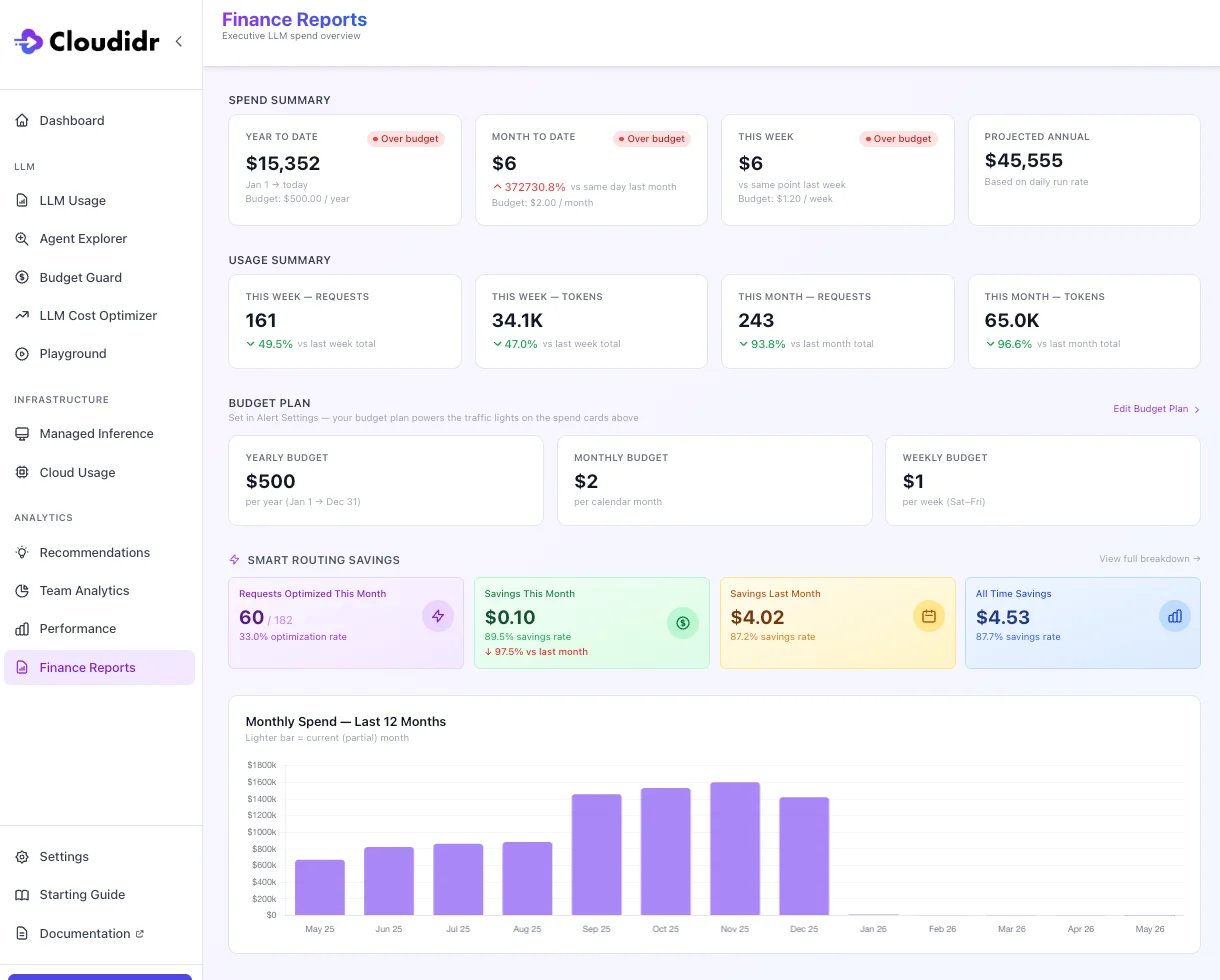
Usage Summary
Four KPI cards that show request and token volume alongside spend, so you can distinguish a cost increase driven by more usage vs more expensive requests:
Tokens are formatted as
89.2M, 1.4B etc. for readability.
Budget Plan
A read-only view of your budget thresholds (Yearly, Monthly, Weekly) pulled directly from Alert Settings. Click Edit Budget Plan to update them in Alert Settings.Budget thresholds power the traffic lights on the Spend Summary cards. If no budget is set for a period, the traffic light badge is hidden.
Smart Routing Savings
Shows the savings generated by Cloudidr’s model routing for the current and previous month, plus all-time. See LLM Cost Optimizer for details.12-Month Spend Chart
A month-by-month bar chart of LLM spend for the past 12 months. The current (partial) month bar is shown in a lighter shade. Toggle between Spend, Requests, and Tokens views using the buttons above the chart.Spend Tables
Five ranked tables filtered by the period selector at the top (Current Week, Last Week, Current Month, Last Month, Last 90 Days, Year to Date). Default is Current Week.
Toggle columns between Spend, Requests, and Tokens using the metric selector above the tables. A date-range sub-label below the period buttons confirms the exact dates being shown.
Disclaimer: Spend figures are estimates based on published list prices. Provider discounts, marketplace credits, and rounding may cause differences from your actual invoice.
Email Weekly Finance Summaries
Navigate to Settings → Reporting (visible to account owners only).Weekly Executive Emails
Enable a weekly HTML email sent every Monday at 08:00 UTC to a configurable list of recipients. To configure:- Toggle Enable Weekly Executive Emails to on.
- Add recipient email addresses (one per line or comma-separated).
- Click Save.
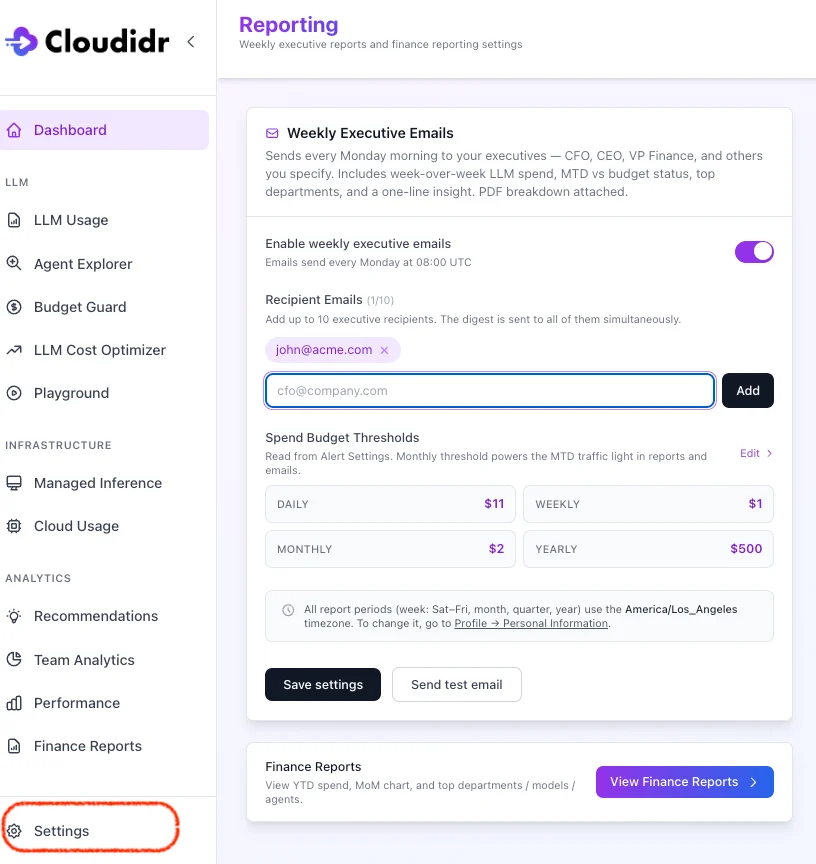
What the email contains
Each email covers the previous full week (Saturday 00:00 → Friday 23:59) in your org’s reporting timezone and includes:
The email footer includes a link to the full Finance Reports page and a link to manage recipients in Reporting Settings.